Our Knowledge Graphs
SciBite loves Knowledge Graphs. We use them all the time in customer projects for use cases such as drug repurposing, target prioritization, drug safety profiling, and organizing experimental data.
Knowledge graphs depend on the ability to map between equivalent concepts from different sources of data, and the SciBite platform is the perfect technology to enable this. Our semantic annotation tools scan vast quantities of scientific publications, normalising these scientific concepts to unique entity IDs as it goes. These IDs are mapped to a whole host of public standards, enabling us to pull together evidence mined from the literature, alongside supporting evidence from the public domain or a customer’s internal data systems.
This approach puts the power in the hands of the user to ask questions like:
- What genes are most strongly associated with a disease in the literature, and is there supporting evidence from other sources (e.g., GWAS, OMIM, Orphanet)?
- Show me all drugs which are known to inhibit my target of interest, and list out the key adverse events
- What drug target should I prioritize in my disease area based on known mechanisms, safety profiles, and competitor activity?
We offer all our customers the tools to build such graphs in-house, making use of our technology to create the foundational data. From here, data can be easily formatted for loading into graph database systems, such as Neo4J, Stardog, and many more.
Read more to discover more about SciBite’s unique expertise in this area…
What is a Knowledge Graph?
Within technology, there are a plethora of definitions to describe a knowledge graph. These vary in both clarity and complexity depending on the nature of the application, however, a clear and simple definition we use at SciBite states: a semantic graph that integrates information into an ontology.
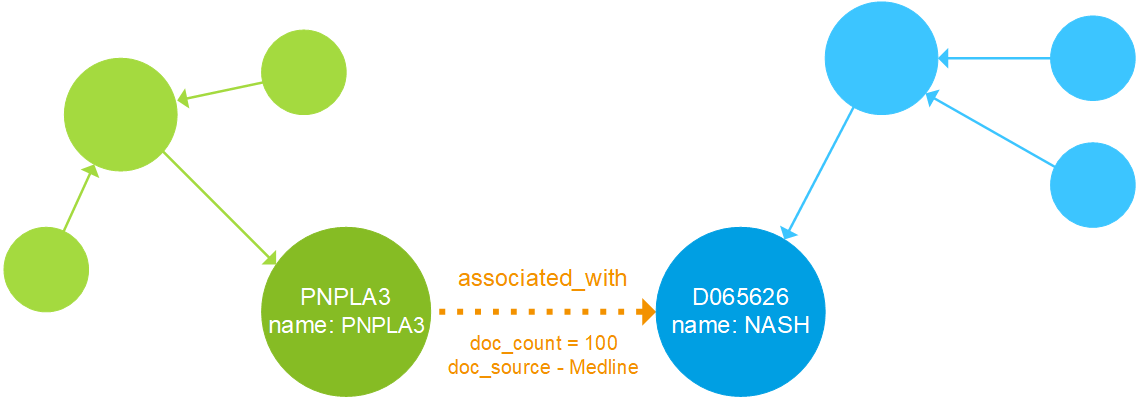
Within a knowledge graph, entities (i.e., “things”) are represented as nodes or vertices, with associations between these nodes captured as edges or relationships. In addition, nodes and edges may hold attributes that describe their characteristics.
This definition is illustrated in the knowledge graph below. Nodes are represented as circles and edges as arrows, with attributes allowed on either. Entities are captured in ontologies, with green nodes representing genes and blue nodes representing indications.

When we say that a knowledge graph is “semantically enriched,” we mean that entities within the graph are aligned to one or more ontologies.
For example, a node that has the name NASH is meaningless by itself. To a scientifically knowledgeable person, it may be clear that this node refers to a disease, but how would a computer assign a type to this node – is it a gene, a drug, or even a person? Furthermore, which other nodes may it interact with, and via what type of edge?
A knowledge graph solves this problem by labeling the NASH node as a disease. By aligning this node to a disease ontology, the computer can start to understand that entity in the context of other node types that may also be in the knowledge graph. Simply put, a knowledge graph understands real-world entities and their relationships to one another – in the words of Google: “…things, not strings”.
If we also have genes in the knowledge graph, we can add edges between diseases and genes that describe associations in the form GENE -> associated with -> DISEASE.
Read our blog on What exactly is a Knowledge Graph: Using Semantic Enrichment to connect the dots.
Data representation in Knowledge Graphs
A knowledge graph can be used to connect data from many heterogeneous data silos – internal or external – provided entities are harmonised to common identifiers.
Unlike more restrictive relational databases, knowledge graphs allow for the creation of typed relationships with attributes attached in a more intuitive representation than foreign keys or join tables. Knowledge graphs do not rely on a prohibitive schema and can be updated and modified as required. In addition, aligning data in a knowledge graph to ontologies automatically captures the associated metadata. Finally, once data has been integrated into a single view, inferences can be made that would otherwise have been unseen.
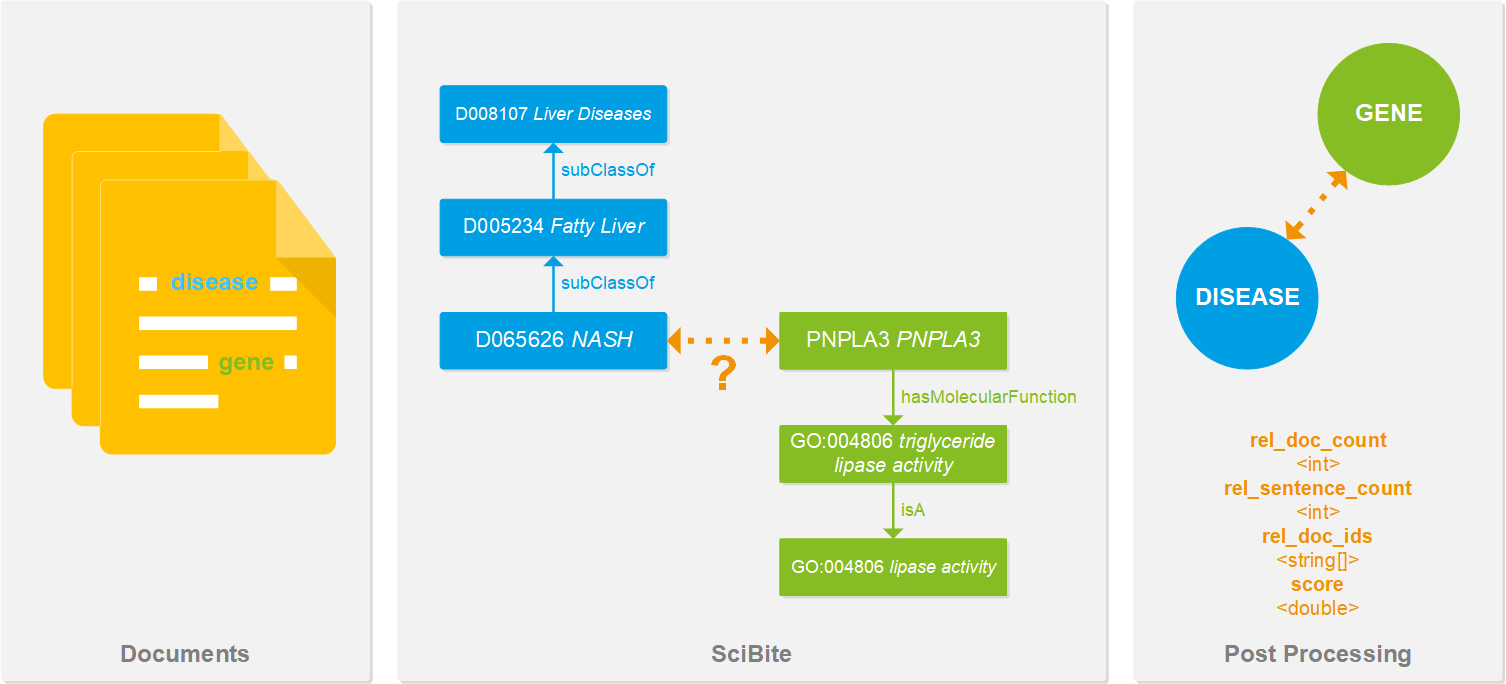
The diagram below shows semantic triples being extracted from textual data using SciBite. Our platform can extract semantic triples from text and align these entities to their extensive set of ontologies. Once aligned, this data can be effortlessly fed into any knowledge graph.

The technology supporting knowledge graphs has matured in recent years and is now scalable. Graph databases and triplestores with intuitive query abilities have also dramatically reduced the barrier to entry for those interested in employing knowledge graphs.
To get the most out of a knowledge graph, it is important to understand the use case you are trying to address from the outset. There are typically two approaches to creating knowledge graphs: at an enterprise level for search or at a project level to enable inferences.
An enterprise knowledge graph will be more abstract, and include data from many departments within an organization, for example, finance, HR, legal and R&D, etc. In these circumstances, users are viewing the data from different aspects or through a particular lens.
At a project level, the use case is more clearly defined: what specific questions do we want to ask of the knowledge graph? For example, an exercise in target prioritization will require a focus on gene-disease associations and relevant datasets. In this use case, the addition of HR documents would be unlikely to help.
SciBite’s role in generating Knowledge Graphs
How does SciBite help facilitate the production of knowledge graphs? This can be broken down into four areas.
1. Ontologies
Ontologies provide the backbone of any knowledge graph project. SciBite has an extensive set of ontologies covering over 120 life science entities, including genes, drugs, and diseases. Additionally, SciBite has the tools to create, extend, merge, and manage these ontologies.
2. Harmonisation of datasets
As already discussed, creating knowledge graphs hinges on the ability to integrate and harmonise data from multiple sources. For example, if one dataset refers to NASH as “Non-alcoholic steatohepatitis” and the other simply as “NASH,” how do we align these to the single MESH identifier D065626?
This is where SciBite comes in: our ability to align entities to single IDs captured in our ontologies allows structured data to seamlessly be cleaned and integrated, whether from internal or external data sources.
3. Extraction of triples from textual data
SciBite can extract semantic triples from text and align these entities to their extensive set of ontologies. Once aligned, this data can be fed into any knowledge graph alongside any other structured datasets, as shown above.
4. Schema generation
SciBite technology can enable the creation of a high-level metagraph of the relevant entities and the relationships that can exist between them in your knowledge graph, a simple representation using an initial ‘bridging ontology’.
This functionality provides the basic ingredients for a knowledge graph pipeline. By knitting the pieces together in a connected workflow, you can see how SciBite can support the creation of ontologies while also harmonizing and integrating data from both unstructured and structured data sources. Such a pipeline could be semi-automated or even automated, depending on the use case.
Platform independence
SciBite’s capabilities are completely agnostic to the technology used to represent or store knowledge graphs. So whether you’re an RDF expert (check our blog on SciBite & RDF – A natural semantic fit) looking at triple stores supporting SPARQL endpoints, or more interested in the ease of use that comes with LPGs and more intuitive graph query languages, we can help.
Watch our webinar on Creating Knowledge Graphs from Literature to learn more.
How could the SciBite semantic platform help you?
Get in touch with us to find out how we can transform your data
© Copyright © 2024 Elsevier Ltd., its licensors, and contributors. All rights are reserved, including those for text and data mining, AI training, and similar technologies.
