Rare disease collaboration networks
Disease Detective Part 1: In celebration of Rare Disease Day 28th Feb, we have a 3 part blog post looking into some of the challenges/analysis techniques involved in the research process.
Rare diseases are big news for pharmaceutical companies now – and not just because of Rare Disease Day (Tuesday 28 February, by the way). Why? These are conditions affecting fewer than 1 in 2,000 people, and drug development is an extremely expensive process – surely focusing on these niche areas isn’t financially viable?
Incentives now in place to encourage pharmaceutical companies to develop treatments for rare diseases (or orphan drugs), have changed all that. Orphan drugs are now extremely profitable and companies including them in their portfolio can experience a considerable increase their market value.
It’s still a costly and long journey though, with a number of hurdles along the way. Over the course of this and the next two blogs, we’ll examine each of those hurdles and show how SciBite’s technology can help pharma to overcome them. The three biggest issues for researchers in this area are:
- Finding other researchers working on relevant areas for collaboration
- Faster, deeper research into the mechanistic behaviour of rare diseases
- Linking rare diseases through shared phenotypes
Facilitating collaboration networks
It’s in the interest of both academia and pharma to collaborate – they can pool resources, knowledge and experience, reducing duplication and speeding up research and development. In today’s age of Google, you’d be forgiven for thinking that this would be an easier process now. Alas, finding other researchers with the same interest is still difficult.
So if you’re a pharmaceutical company, how do you find out who these experts are and where they’re located?
This is where we come in. SciBite’s technology automates the process of identifying where these centres of excellence exist through the extraction of institution names from scientific publications.
Let’s take the example of the rare disease Pemphigus.
I’ll walk you through the results of our extraction – this is where we mined institution data from PubMed and uploaded it into a graph database to show the most productive institutions, in terms of publications, and also the extent to which they collaborate with other institutions. To navigate the results, we’ve visualised the data in Linkurious.
We started with ~6000 articles relating to the rare disease Pemphigus. According to Orphanet, this affects 1-5 / 10,000 people. Frequent clinical signs include: atypical scarring of the skin, hives, skin blistering and oral ulcers.
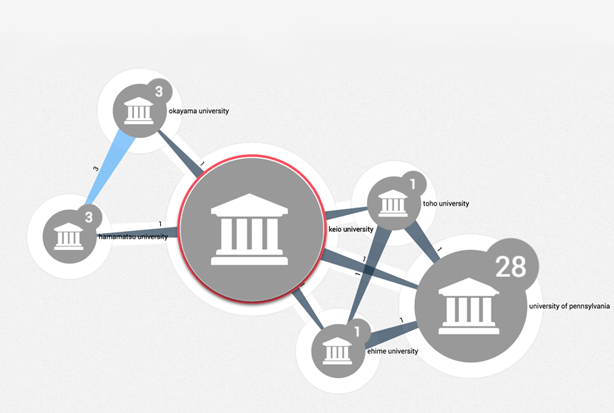
The first image we show is of the institutions who work most closely with other institutions, thus helping to expand expertise in the field. The bigger the circle, the more publications. Lighter blue connecting lines represent higher numbers of co-published papers.

When superimposed onto a map, we can see how these groups are spread across the globe:

We can also zoom in on individual countries to show the major national centres of research. Here is the network map for Japan:

And here are institutions in Europe that have co-published at least once with a Japanese institution:

As well as showing who is working together, we can get a view on whose research has a less collaborative focus. For example, Keio University has the most publications from our analysis but relatively few collaborative papers. The number on the connecting lines show the counts of jointly published work:

The great thing about using a graph database to store this type of information is that the model is scalable to include millions of nodes and relationships of various types whilst still enabling easy retrieval of content. As you can see from the images, through layering a visualisation solution such as Linkurious on top of this data, it becomes possible to interactively explore the data, allowing you to zoom in, focus on an area and bring to light new relationships that may not have been obvious from manually reading the text alone.
You can imagine how useful this, as a package, is for a range of organizations – no doubt you belong to one of them:
- Funding bodies – where best to invest
- Research institutions – easier to identify potential collaborative partners
- Pharmaceutical companies – who to approach when looking into Research & Development
Up next in the Disease detective blog series
Read part 2 in the Disease detective blog series “Exploring mechanistically-related diseases through shared phenotypic profiles” Read Part 2
We’ve written a White Paper on how we used a combination of network analysis and Machine Learning techniques to liberate data buried in millions of Medline abstracts. To find out more about our work and how we could best help you, please contact us with your name, contact details and your organization. We’d love to hear from you.
Related articles
-
Exploring mechanistically-related diseases through shared phenotypic profiles
Disease detective part 2: Today, we’ll look at a fresh way of enabling scientific researchers, either in pharmaceutical R&D or in medical institutes to deepen their investigations and consider new links.
Read -

Machine Learning and phenotype triangulation
Disease detective part 3: In our final disease detective article, we’ll take Part 2’s topic a little further and zoom in on how we can find new relationships between diseases where direct evidence is sparse.
Read
How could the SciBite semantic platform help you?
Get in touch with us to find out how we can transform your data
© Copyright © 2024 Elsevier Ltd., its licensors, and contributors. All rights are reserved, including those for text and data mining, AI training, and similar technologies.